
He Customer lifetime value, CLV or LTV, This estimates the economic value of a customer relationship over a defined period. To use it effectively, you must clarify whether it represents revenue, contribution, or net after-acquisition value. A historical figure is also not equivalent to a prediction. This guide suggests first calculating observed data, separating it from projected data, and then examining how decisions change when customer tenure, purchases, and margin vary.
What is customer lifetime value and what is it used for?
CLV means customer lifetime value. It helps to look beyond the first transaction: two customers with an identical initial order can generate very different results if one returns, needs less support, or buys products with a different margin.
The concept is used with different conventions. Stripe's guide to CLV It presents historical, cohort, and predictive methods. Before using a figure from any platform, check its formula, what costs it considers, and its data coverage period. The term "value of life" does not guarantee that all years of the relationship have been observed.
In sales management, it's used to compare customer groups, prioritize experience improvements, and discuss how much acquisition effort the business can sustain. It's an estimate to inform decisions, not a promise of how much someone will buy, nor a reason to neglect those with lower projected value.
CLV of income, contribution, and net: they are not equivalent
| Extent | What does it represent? | What's still missing? |
|---|---|---|
| Cumulative value of income | Net sales per customer over the horizon. | Product, delivery, service and other costs. |
| CLV of contribution | Revenue less variable costs defined to serve and retain the customer. | Acquisition, if excluded, and overhead costs. |
| Value after acquisition | Contribution of the horizon less CAC. | Other expenses and adjustments not considered. |
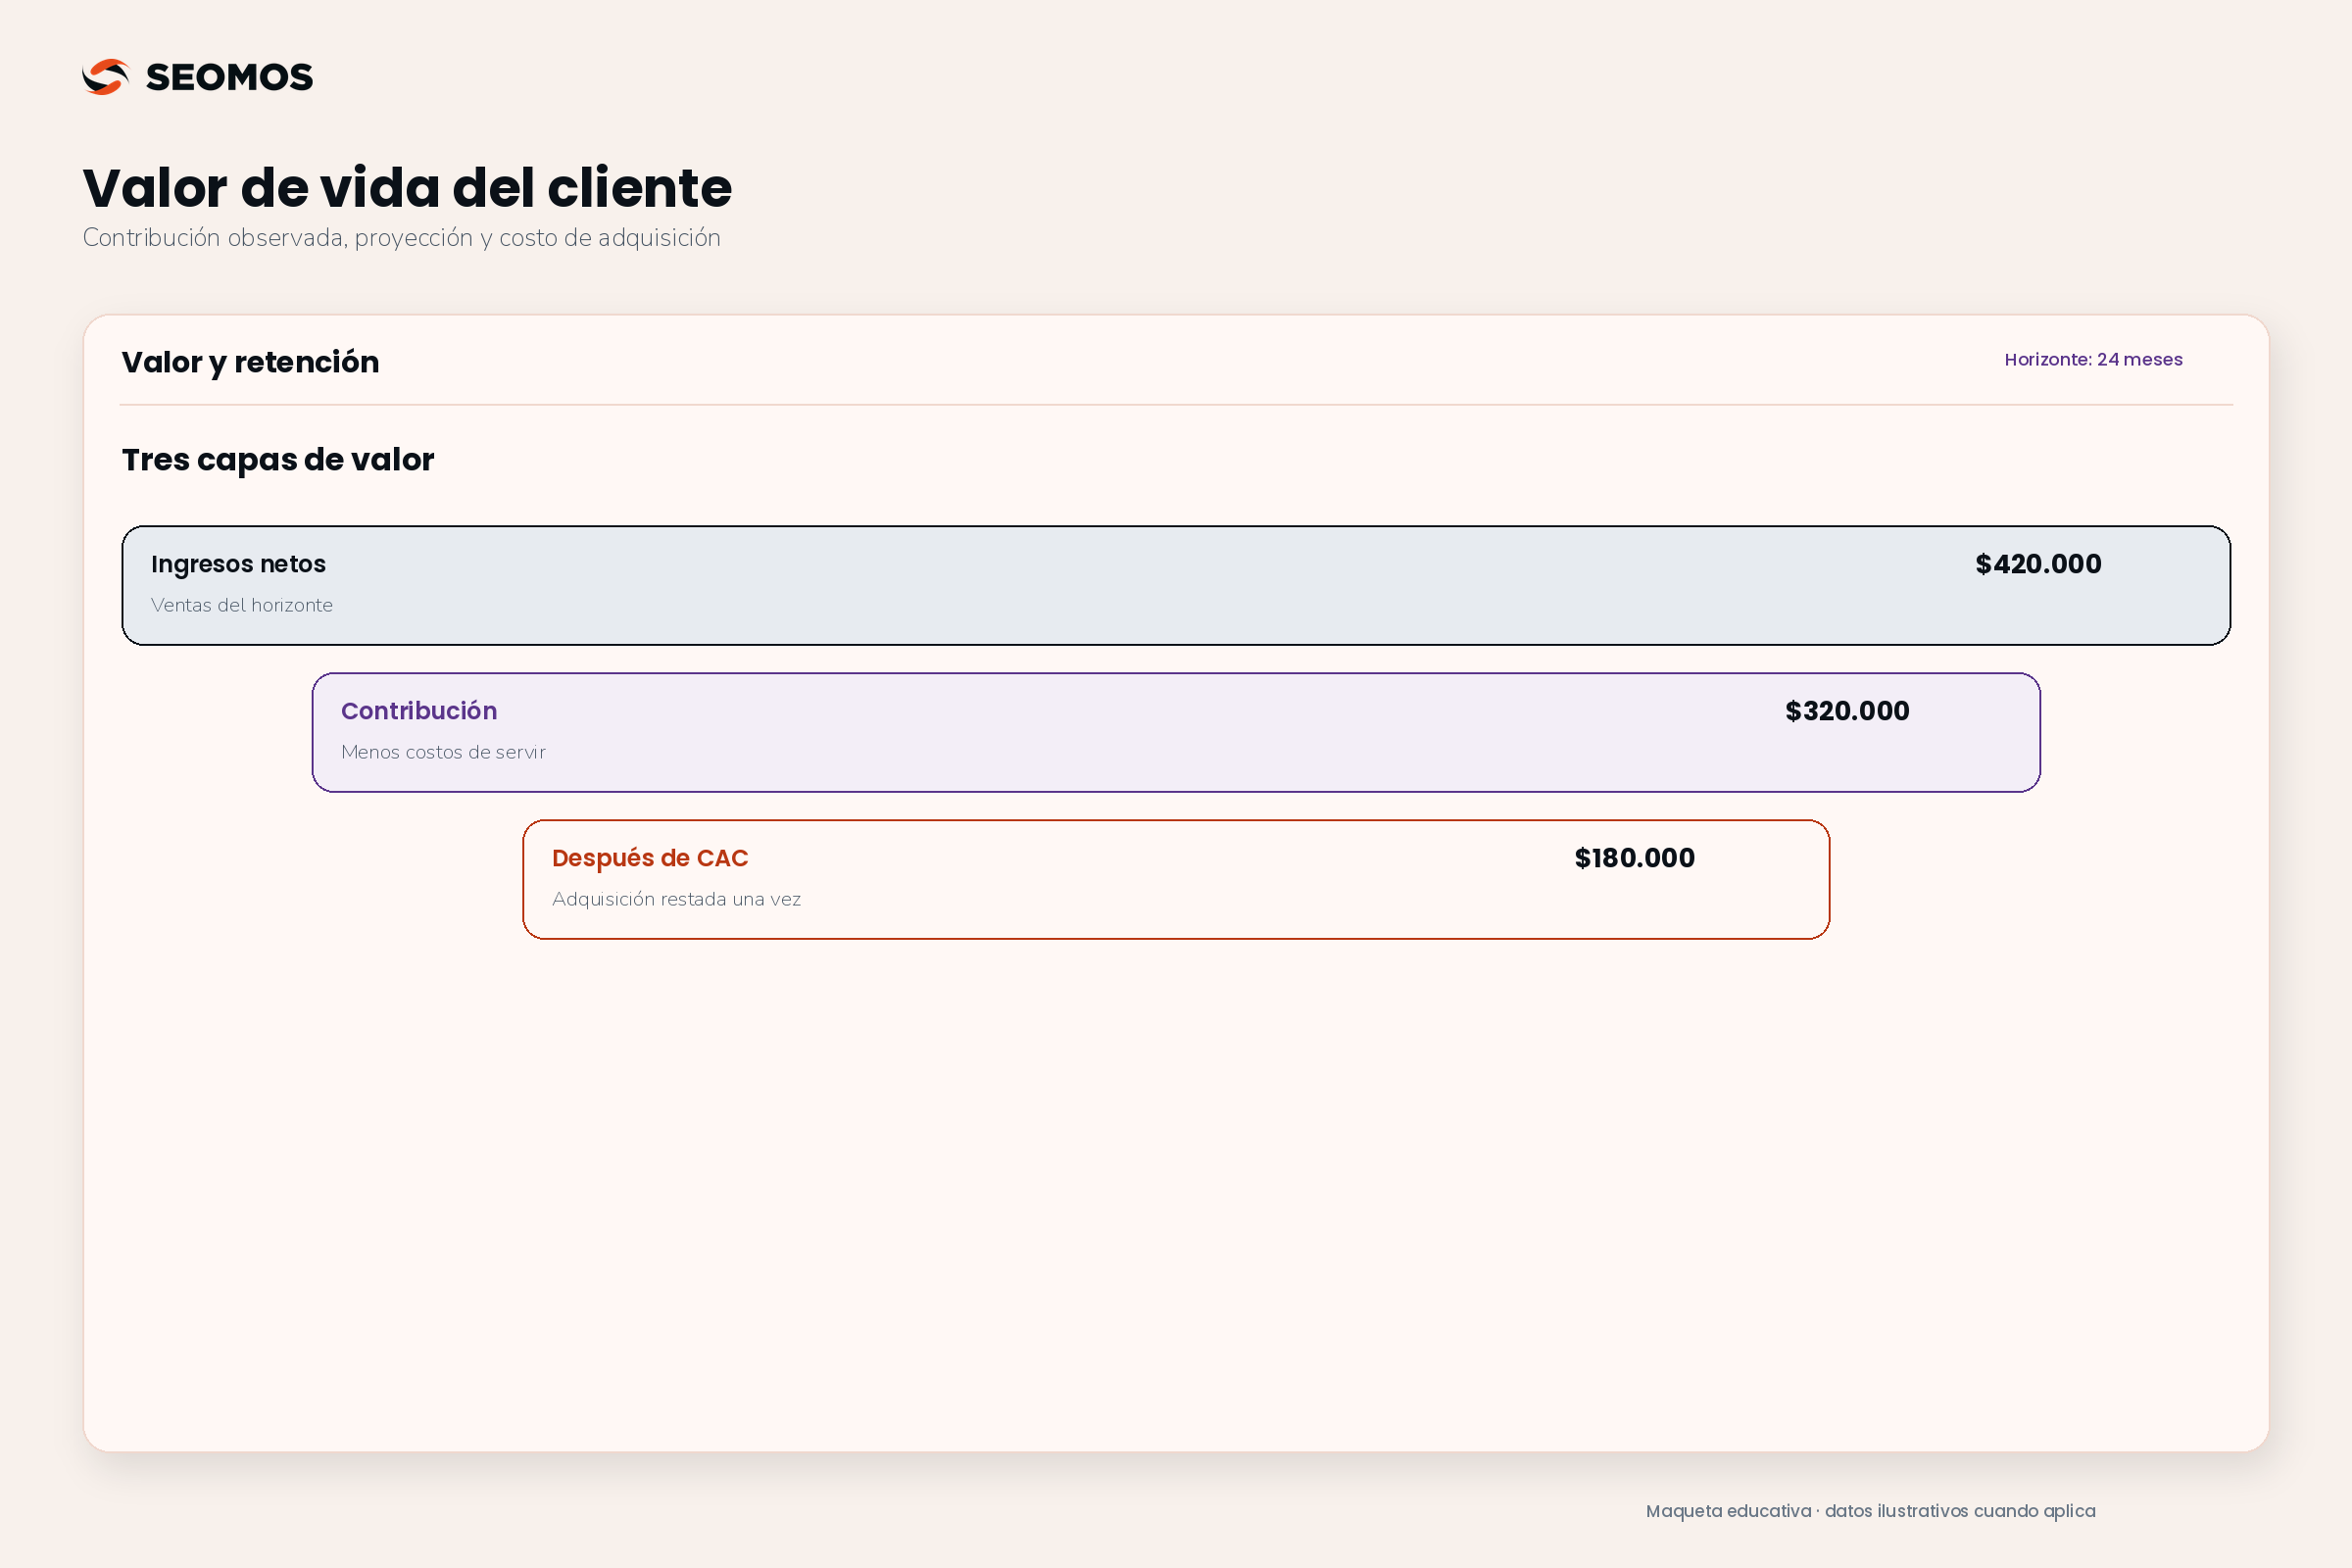
In this guide, the CLV contribution is calculated before CAC. Then the acquisition cost is deducted only once. If your model already includes it, do not subtract it again or compare that value with a ratio designed for pre-acquisition contribution.
The contribution margin does not automatically equate to net profit. OpenStax explains The difference between sales and variable costs helps cover fixed costs and generate profit. We must also specify which customer service and retention costs are included.
Simplified CLV formula and its assumptions
An initial approach is revenue value = average ticket × purchase frequency per period × number of periods. To convert to contribution, you can multiply by a representative margin if it remains stable and includes the relevant costs.
In a hypothetical example, a COP 100,000 ticket, four annual purchases, and a two-year horizon generate COP 800,000 in revenue. If the contribution margin before acquisition is 40% (%), the simplified contribution CLV is 320,000 COP. There are not 800,000 COP available to pay for advertising.
Multiplication assumes that frequency, duration, and ticket size describe the same population. If you combine ticket size from premium customers with frequency from loyal customers and duration from the entire customer base, the result doesn't represent a recognizable average customer. Furthermore, multiplying separate averages can distort the value when those variables are related.
For an initial assessment, it's best to choose a finite timeframe, such as 12 or 24 months, and call it by its name: "contribution per customer over 24 months." Using a precise label avoids presenting a short-term projection as if it covers the entire future relationship.
How to calculate the value per cohort
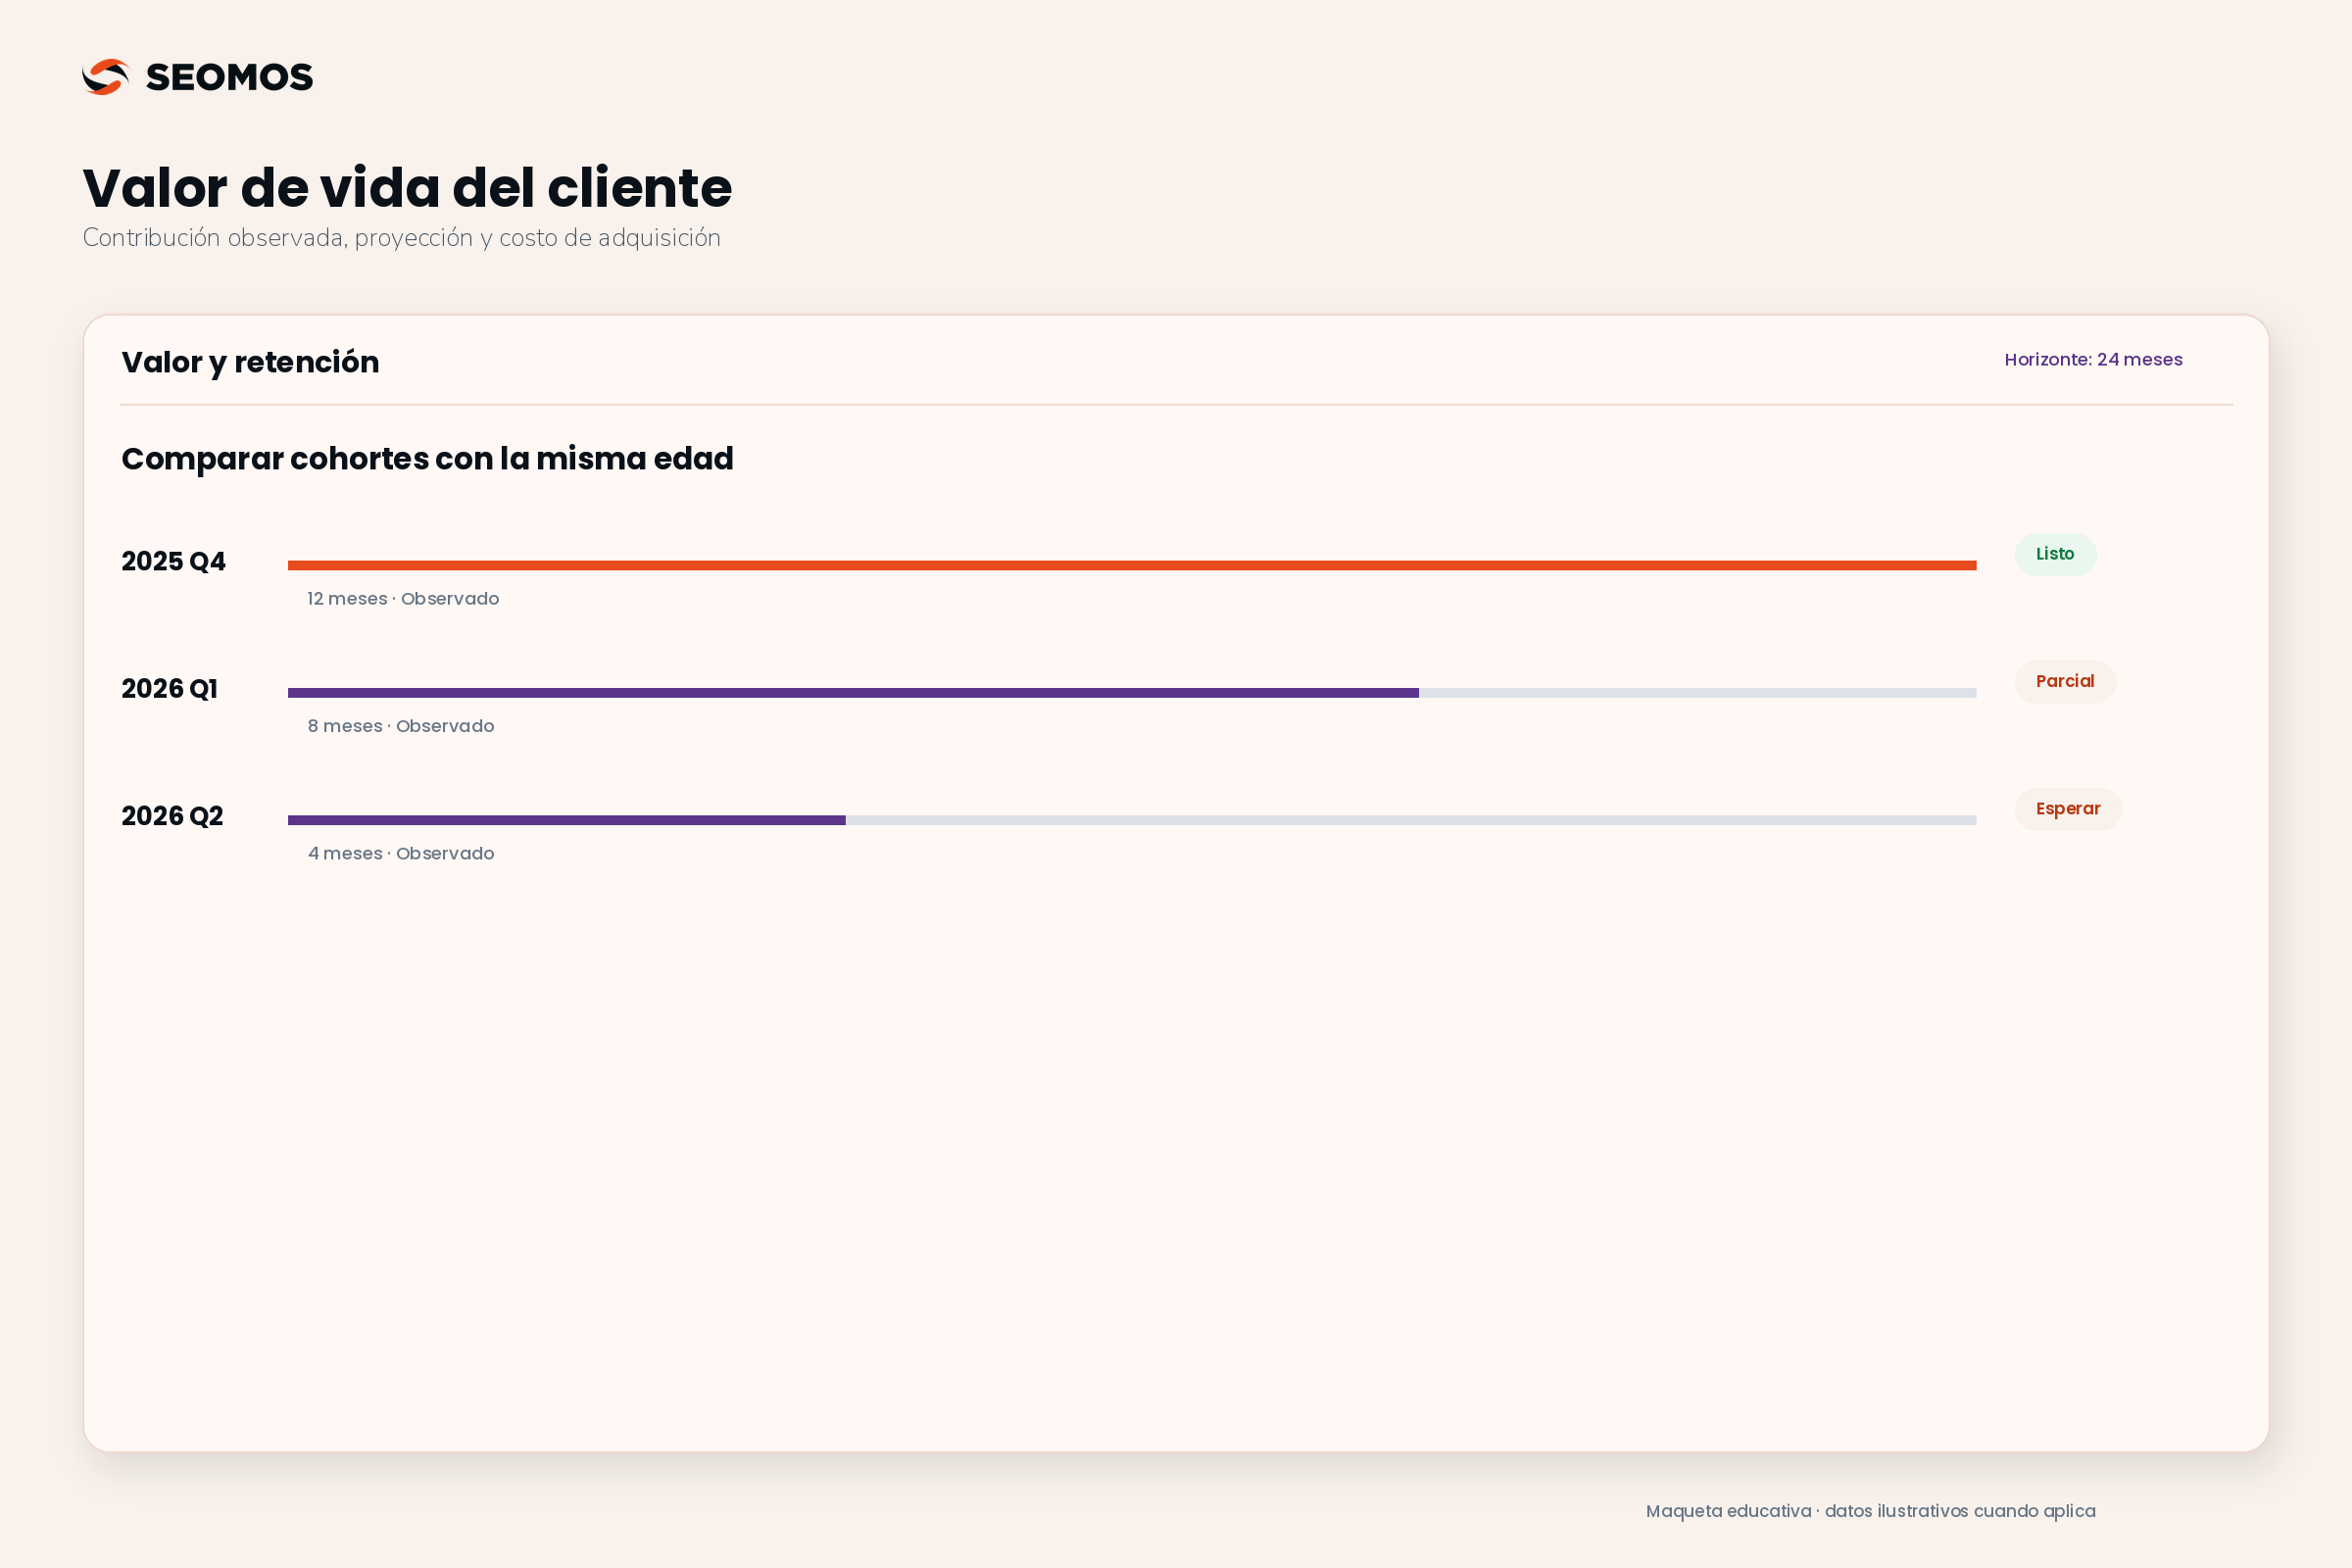
A cohort groups customers who share an entry condition, such as their first purchase month. From that date, you can observe cumulative revenue and contribution over 30, 90, 180, or 365 days. The comparison must be made at the same age as the cohort.
The most important rule is to maintain the original denominator. If you started with 100 customers and only 40 made a purchase in the second year, dividing the second year's sales by 40 represents the number of repeat customers. To assess the value of acquiring a customer from the initial cohort, divide by 100, including those who didn't return.
- Define input and unit. First valid purchase and deduplicated customer; not number of orders.
- Reconcile transactions. It associates sales, returns, and costs with the correct customer and period.
- Set the horizon. Compare cohorts with the same time elapsed since acquisition.
- Separate observed and future. A section that has not yet elapsed must be shown as a projection.
- Check out useful segments. Purchased channel or first category, provided there is sufficient data.
Google Analytics allows explore user cohorts, However, their identity and entry rules must be reviewed before equating them to billed customers. For economic CLV, the order and cost record is the reference that must be reconciled.
Complete example of CLV at 24 months in COP
Hypothetical scenario; not a SEOMOS case. A store follows a cohort of 100 new customers. Upon completion of the first 12 months, it has reconciled sales and costs. Months 13 through 24 have not yet occurred in the fiscal year and are projected based on an explicit assumption of repetition.
| Concept | Months 1–12 observed | Projected months 13–24 |
|---|---|---|
| Net income of the cohort | 48,000,000 COP | 32,000,000 COP |
| Variable costs of serving and retaining | 28,800,000 COP | 19,200,000 COP |
| Contribution before CAC | 19,200,000 COP | 12,800,000 COP |
| Original customers used as a divider | 100 | 100 |
| Contribution per original customer | 192,000 COP | 128,000 COP |
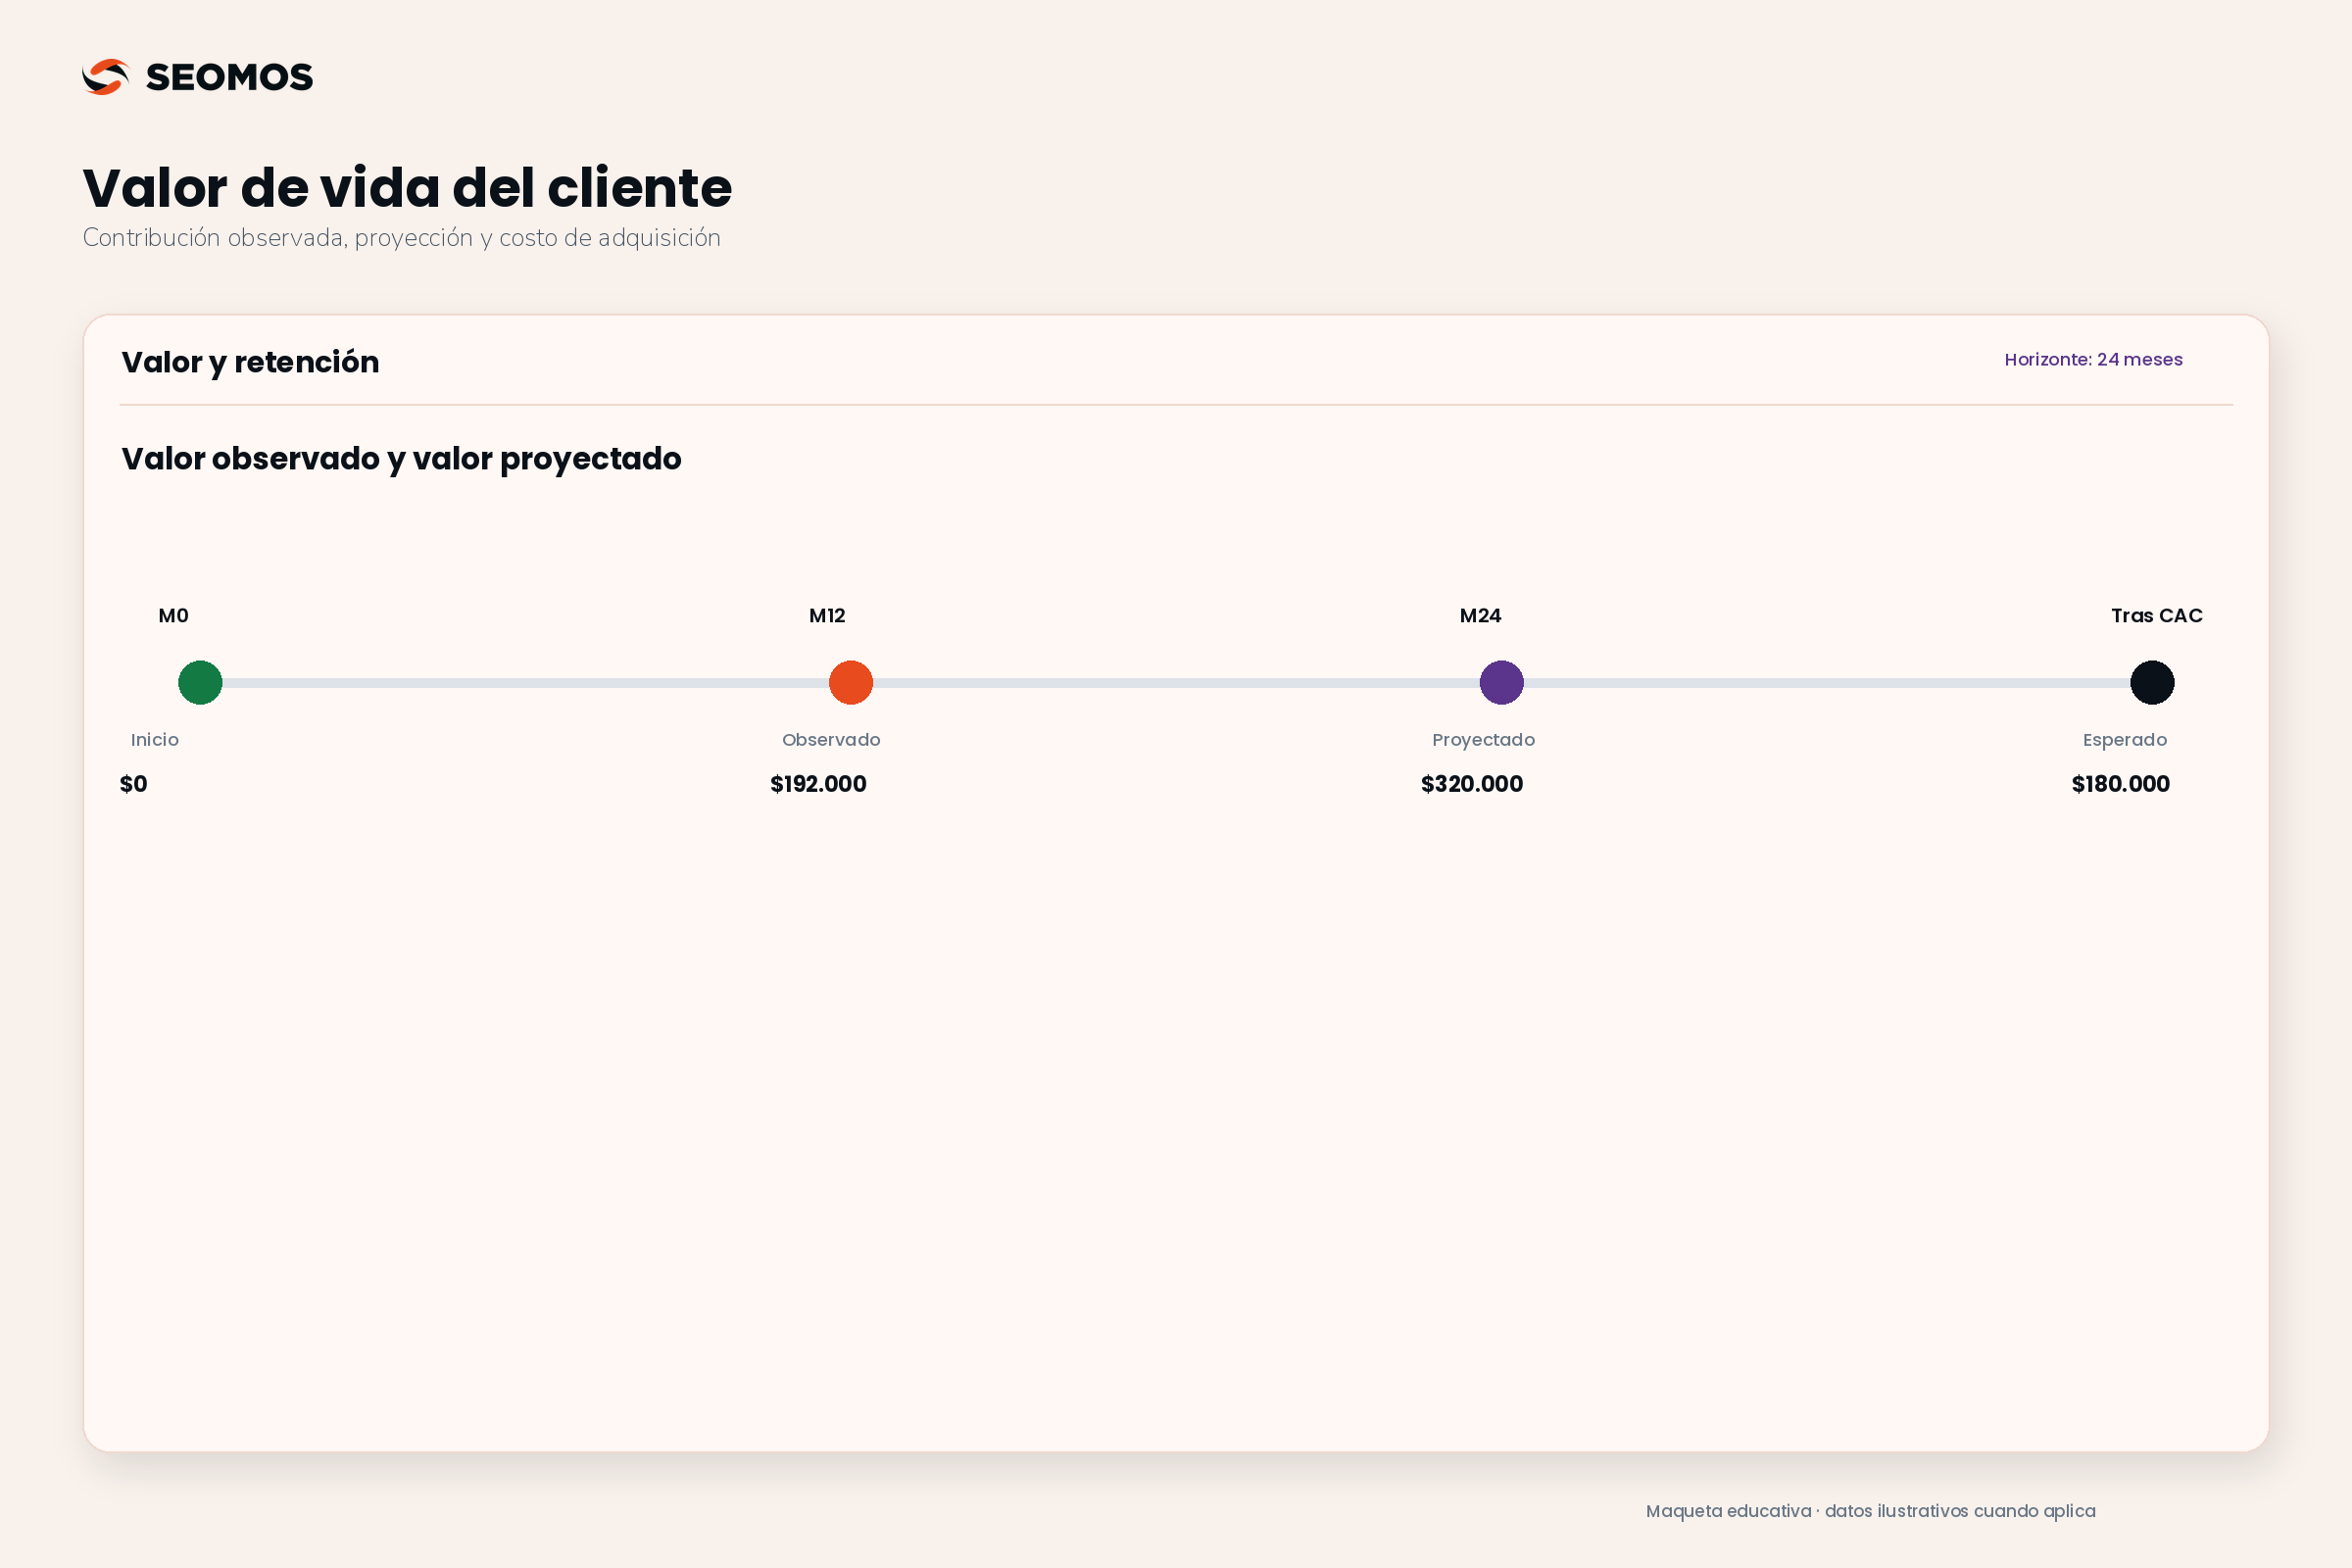
The expected value of income at 24 months is (48,000,000 + 32,000,000) ÷ 100 = 800,000 COP per original customer. The combined contribution is (19,200,000 + 12,800,000) ÷ 100 = 320,000 COP. Only the first 192,000 COP of contribution per customer are observed; the other 128,000 COP remain a projection.
Let's assume a CAC of 140,000 COP per customer for that same cohort. The expected value after acquisition would be 320,000 − 140,000 = 180,000 COP, before overhead costs and taxes not included. The guide of customer acquisition cost It explains how to define that CAC without mixing new and returning customers.
To observe recovery, it's not necessary to wait the projected 24 months. We need to monitor when the actual accumulated contribution exceeds COP 140,000. The fact that the total for the first year is COP 192,000 allows us to conclude that, under the assumptions of the exercise, recovery occurred within that year on average; however, it doesn't allow us to specify the exact month without the monthly breakdown.
How to test if the decision withstands less favorable scenarios
A single CLV can convey more certainty than the data alone. Use scenarios that change only a few identifiable assumptions. In the same exercise, keep the CAC at 140,000 COP and see what happens with different revenues and margins over 24 months.
| Scenery | Horizon revenues | Margin | Contribution before CAC | After CAC |
|---|---|---|---|---|
| Conservative | 600,000 COP | 35 % | 210,000 COP | 70,000 COP |
| Base | 800,000 COP | 40 % | 320,000 COP | 180,000 COP |
| Favorable | 900,000 COP | 45 % | 405,000 COP | 265,000 COP |
These scenarios are not statistical intervals or calculated probabilities. They are planning hypotheses. They allow us to ask whether a decision remains acceptable with less repurchase, more returns, or higher service costs. If it only works with the most favorable scenario, the budget is based on a demanding expectation.
The CLV:CAC contribution ratio for the base scenario would be approximately 320,000 ÷ 140,000 = 2.29. Do not treat this as a universal rating. The same ratio can have different implications depending on whether the recovery takes three months or two years, whether the margin is uncertain, or whether significant costs are missing.
When to consider the time value of money
A future sum does not necessarily have the same economic value as one available today. For long-term horizons, a model can discount each cash flow. OpenStax calculates the present value of cash flows as a way to compare amounts that occur at different times.
To illustrate, let's reconstruct the exercise from the acquisition point and assume that the contribution coincides with cash flows, that each annual amount occurs at the end of the year, and that a hypothetical annual rate of 10 % is used. The value would be 192,000 ÷ 1.10 + 128,000 ÷ 1.10² = approximately 280,331 COP, before CAC.
Subtracting a CAC of COP 140,000 disbursed initially would yield approximately COP 140,331 under that model. The 10 % rate is for illustrative purposes only; it is not a recommendation for your company. In a real-world calculation, collection dates, costs, risk, and interest rates require proper definition; discounting revenues without first converting them into comparable cash flows does not resolve these issues.
CLV in subscriptions: be careful with splitting between churn
Some tools use an approach based on recurring revenue and churn. Stripe Billing documents your LTV as average revenue per user divided by the subscriber churn rate. That's a convention of the tool and an estimate, not an automated profit measurement.
Hypothetical subscription example. With a monthly income of COP 100,000 and a monthly churn rate of 5, the division generates COP 2,000,000. Interpreting this requires strong assumptions about income stability and churn probability, as well as a compatible definition of the time period. It should not be extrapolated without limits when there are few observations, seasonality, price changes, or different populations.
If no cancellations were observed, don't conclude that customer value is infinite. Time may be lacking. It's more defensible to report observed value and finite retention scenarios than to present a division by zero as a business advantage.
How to improve customer value without inflating the projection
Choose a specific friction point: post-purchase doubts, delivery expectations, difficulty using the product, or a repeat purchase that requires too much effort. online store with a clear experience It can help solve some of those problems, but its impact must be verified in behavior and contribution.
Promotions also have a cost. If they increase frequency but reduce margin, the value can worsen. Evaluate the effect of messages or reminders with defined criteria and avoid sending communications without an appropriate basis. marketing automation It must retain consent, relevance, and supervision.
Organize sales and customer statuses before seeking complex predictions. You can bring these requirements into a conversation about SEOMOS AI CRM, Validate which features and integrations your case requires. Don't assume that a tool will automatically calculate your specific definition of CLV.
Finally, incorporate the observed value into your KPI tracking along with cohort size, returns, margin, and update date. It recalculates projections when assumptions change and saves the previous version to assess whether the model was overly optimistic.
Frequently asked questions about customer lifetime value
Do CLV and LTV mean the same thing?
They are often used to describe the value of a customer relationship, but the formula can vary between teams and tools. Check if the indicator reflects revenue, contribution, or net value; if it is observed or projected; and if it includes acquisition and temporary discounts.
How do I calculate CLV if my business is new?
Start with revenue and contribution observed over short periods. For the future, build explicit scenarios with reasonable duration and frequency, without presenting them as factual history. Don't assign years of relationship to customers who have only been buying for a few weeks.
Should I only use repeat purchase customers?
Not if you want to evaluate the expected value of acquiring a customer from the original cohort. Keep all initial customers in the denominator, including those who don't return. You can analyze repeat buyers separately, but their average answers a different question.
What CLV:CAC ratio is good?
There is no single ratio that guarantees sustainability for all businesses. First, verify that the CLV uses an economic basis compatible with the CAC. Then, consider payback period, liquidity, uncertainty, and overhead costs. A favorable projection does not equate to available cash.
Does Google Analytics calculate all customer profitability?
It's not simply about displaying value metrics. Its analysis depends on the available events, values, and identities. To understand contribution and profitability, you need to integrate or reconcile costs, returns, and business customers, and verify the reporting timeframe.
Does a higher CLV prove that a campaign worked?
It can be a useful signal, but so can changes due to customer mix, pricing, or observation time. Compare equivalent cohorts and distinguish association from causality. To attribute the change to an intervention, define an evaluation that controls for these differences as much as possible.
Sources consulted
Consultation and editorial review: . The amounts, margins, horizons, and discount rates used in the exercises are hypothetical.