

A KPI is a key performance indicatorA KPI is a measure chosen to evaluate progress toward an important goal. It's not enough for it to simply appear on a dashboard. It must have a definition, a target, a data source, a frequency, and a person responsible for taking action. In marketing, the right KPI connects activity and business results without confusing visits, leads, and customers.
What does KPI mean and why does it matter?
KPI comes from key performance indicator. The Tableau documentation It describes it as a measure that allows you to evaluate how a company is progressing toward key objectives. The key is in "key": an organization can record hundreds of metrics and only need a few to guide a specific decision.
Imagine a company that wants to generate suitable leads for its sales team. It can measure impressions, clicks, visits, forms, conversations, proposals, and contracts. All of these provide information, but not all of them alone indicate whether it's achieving its goal.
A KPI helps focus the conversation: what we were trying to achieve, what happened, what explains the difference, and what we will do next. If a number doesn't change any decisions, it should perhaps remain as a diagnostic metric and not be the focus of the report.
Difference between objective, KPI, metric and goal
| Element | Function | Hypothetical example |
|---|---|---|
| Aim | Express the desired result. | Increase suitable business opportunities. |
| KPI | Measure the priority progress towards that result. | Qualified applications received per month. |
| Goal | Set a level and a deadline. | Increase from 80 to 100 per month by the end of the quarter. |
| Diagnostic metric | It helps to understand why the KPI changes. | Percentage of applications that meet the profile. |
| Control indicator | Monitor to ensure that no other relevant condition deteriorates. | Cost per qualified application and response time. |
The classification depends on the context. Response time can be a control indicator for acquisition and the primary KPI for a customer service project. Visits may be relevant for an outreach initiative, but insufficient to demonstrate sales.
Don't confuse a task with an outcome either. "Publish eight articles" describes an activity. "Get relevant leads from informative content" describes a desired effect. You can track both, but completing the first task doesn't automatically produce the second result.
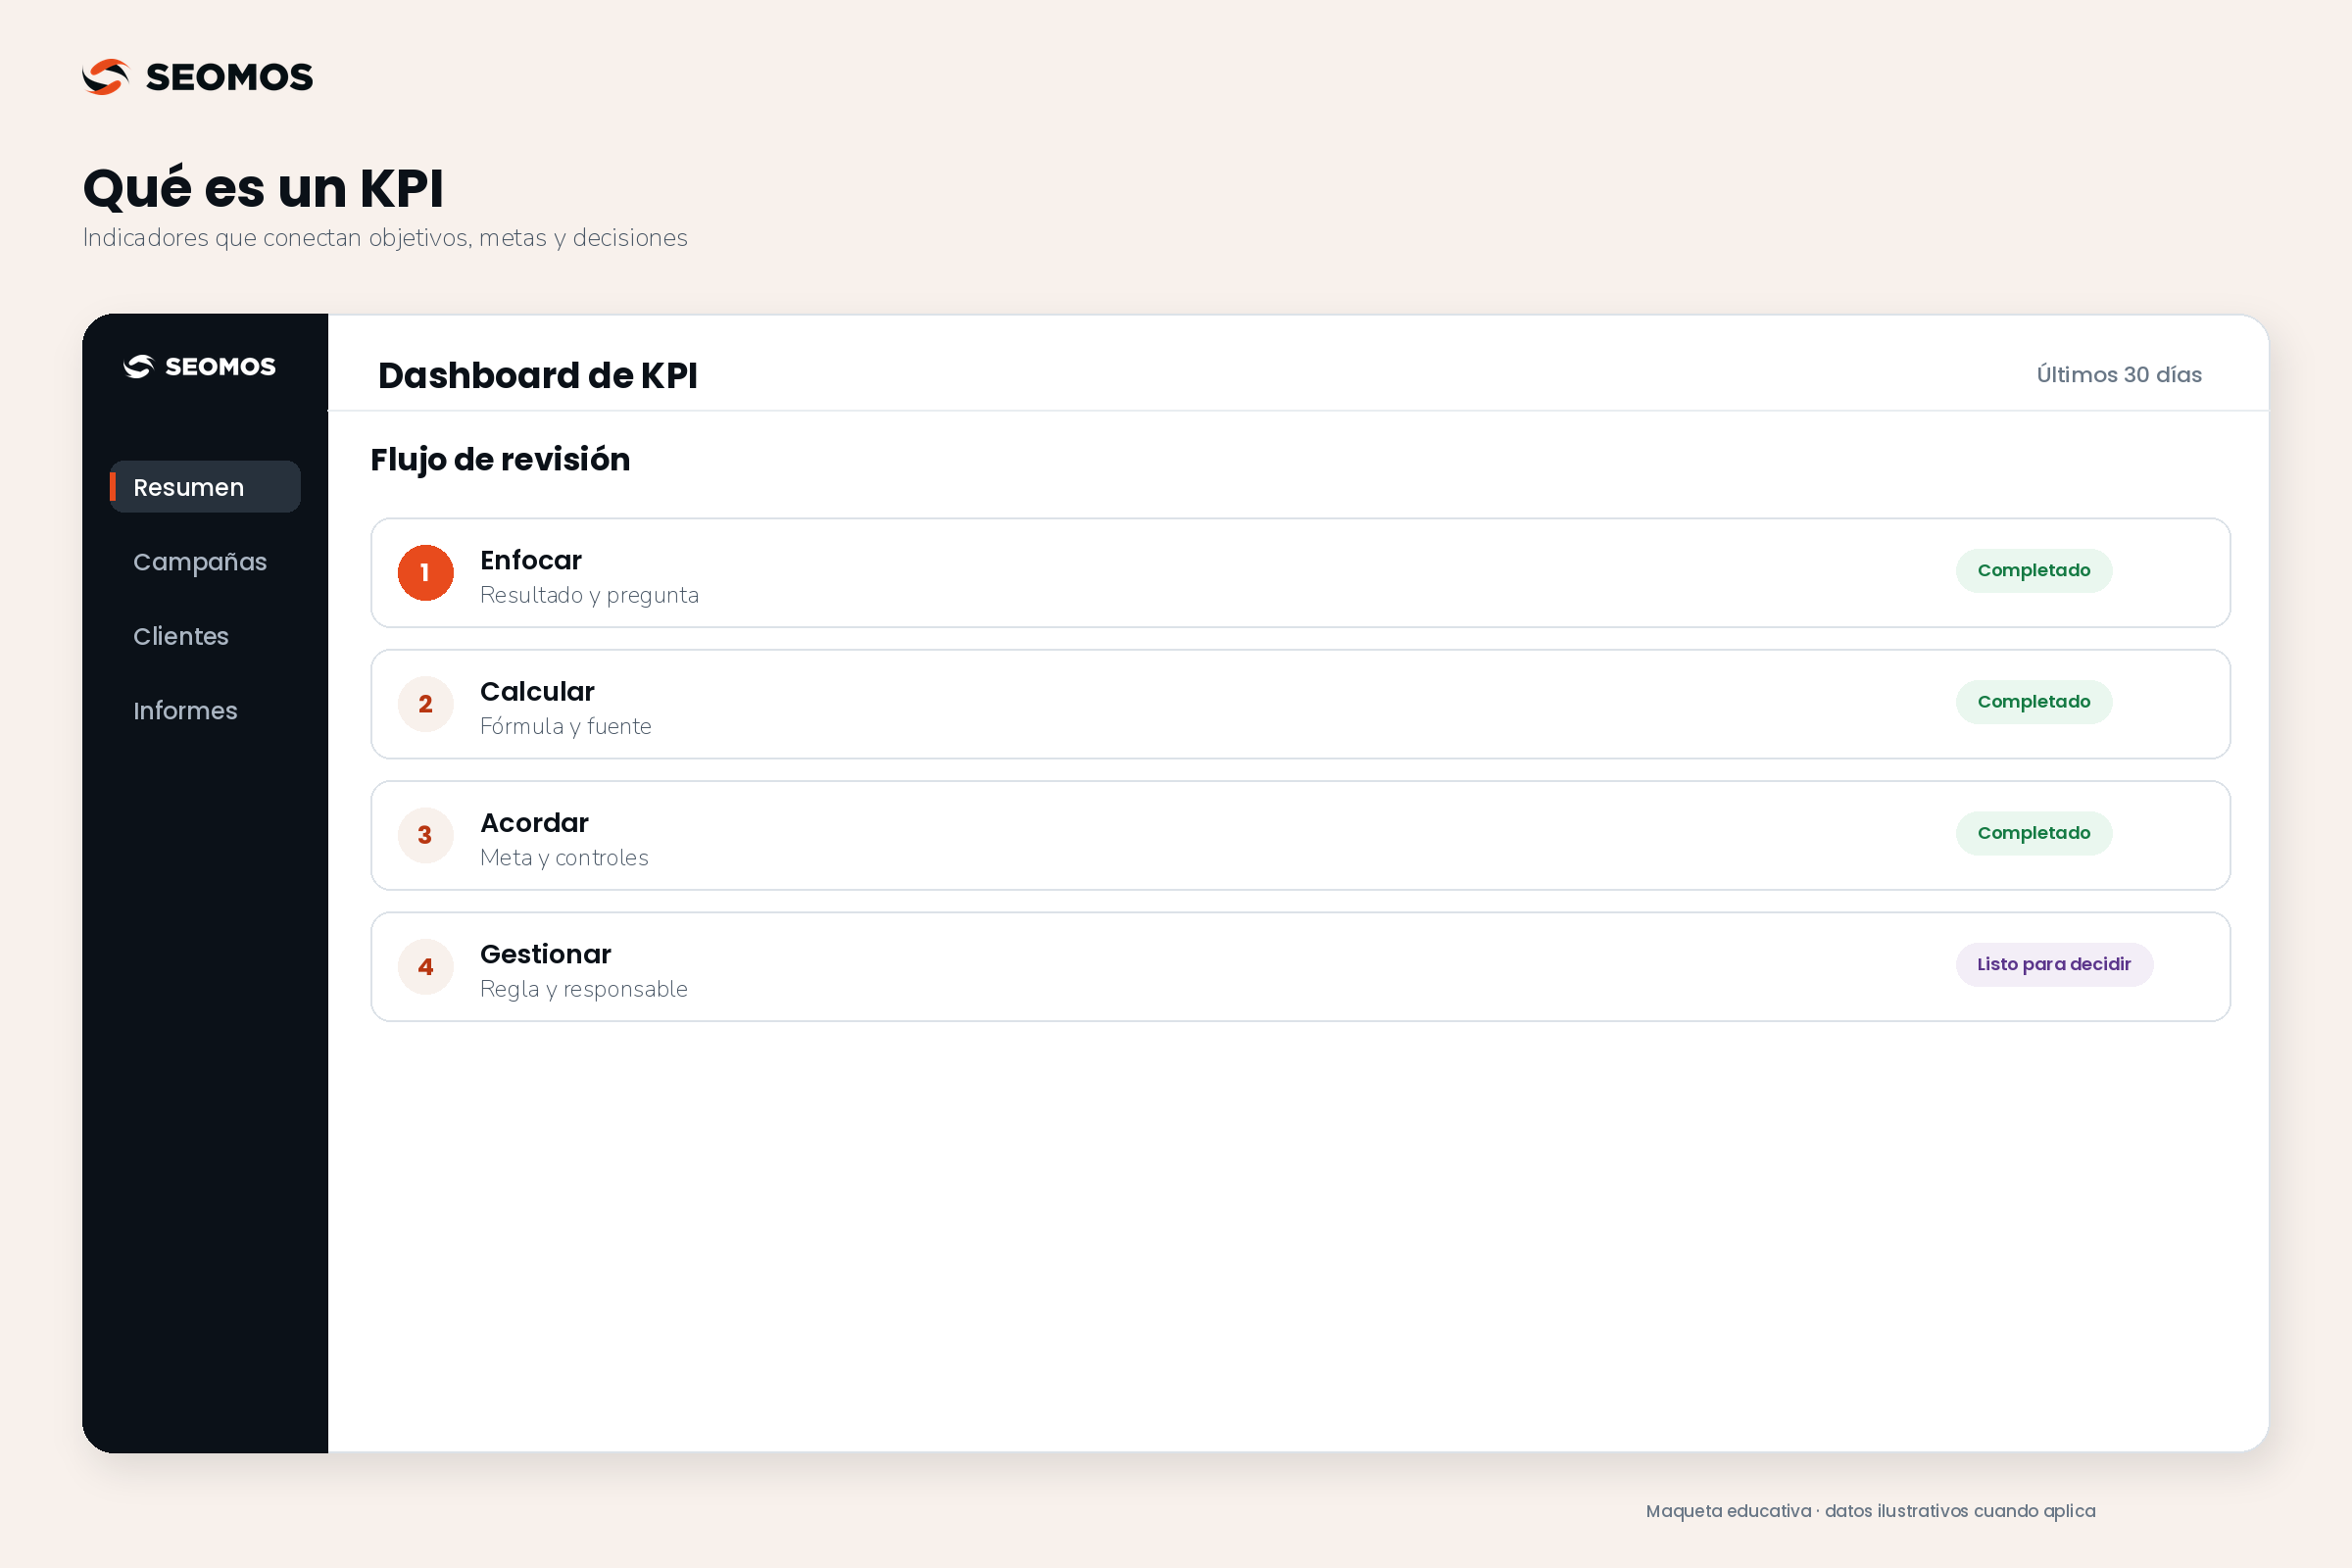
How to choose a KPI: a six-step process
1. Define the outcome and the population
Write down what you want to change and for whom. «Improve marketing» doesn’t identify a decision. «Increase qualified requests for the main service in Colombia» better defines the task. If there are segments with different sales cycles, avoid treating them as if they will respond the same way.
2. Formulate the question that the indicator should answer
For example: Are we generating enough suitable opportunities with the resources available? This question allows us to discard flashy metrics that don't help answer it. It also forces us to define what "suitable" means before reviewing results.
3. Document the formula and its exclusions
If you choose a rate, write the numerator and denominator. "Conversion" could mean forms per session, purchasing users per user, or sales per lead. These are different calculations. Document duplicates, spam, cancellations, and attribution rules to ensure two people get the same number.
4. Establish a baseline and an explainable goal
Use a period that is sufficiently representative of the process. Consider seasonality, budget, and operational capacity. The goal should be linked to a business hypothesis or need; choosing a percentage because it sounds ambitious doesn't help with planning.
5. Assign responsibility, frequency, and source
One person should be responsible for the review and coordinate the actions, even though the outcome depends on several areas. This person defines who maintains the data and who makes the decisions. Daily reviews can help detect errors; evaluating effectiveness may take weeks or months, depending on the cycle.
6. Define what you will do in the face of a change
Write a research rule: if the proportion of qualified applications drops, review queries, ads, and reasons for rejection. Don't turn every variation into an automatic stop-campaign order. First, check data quality, sample size, and context changes.
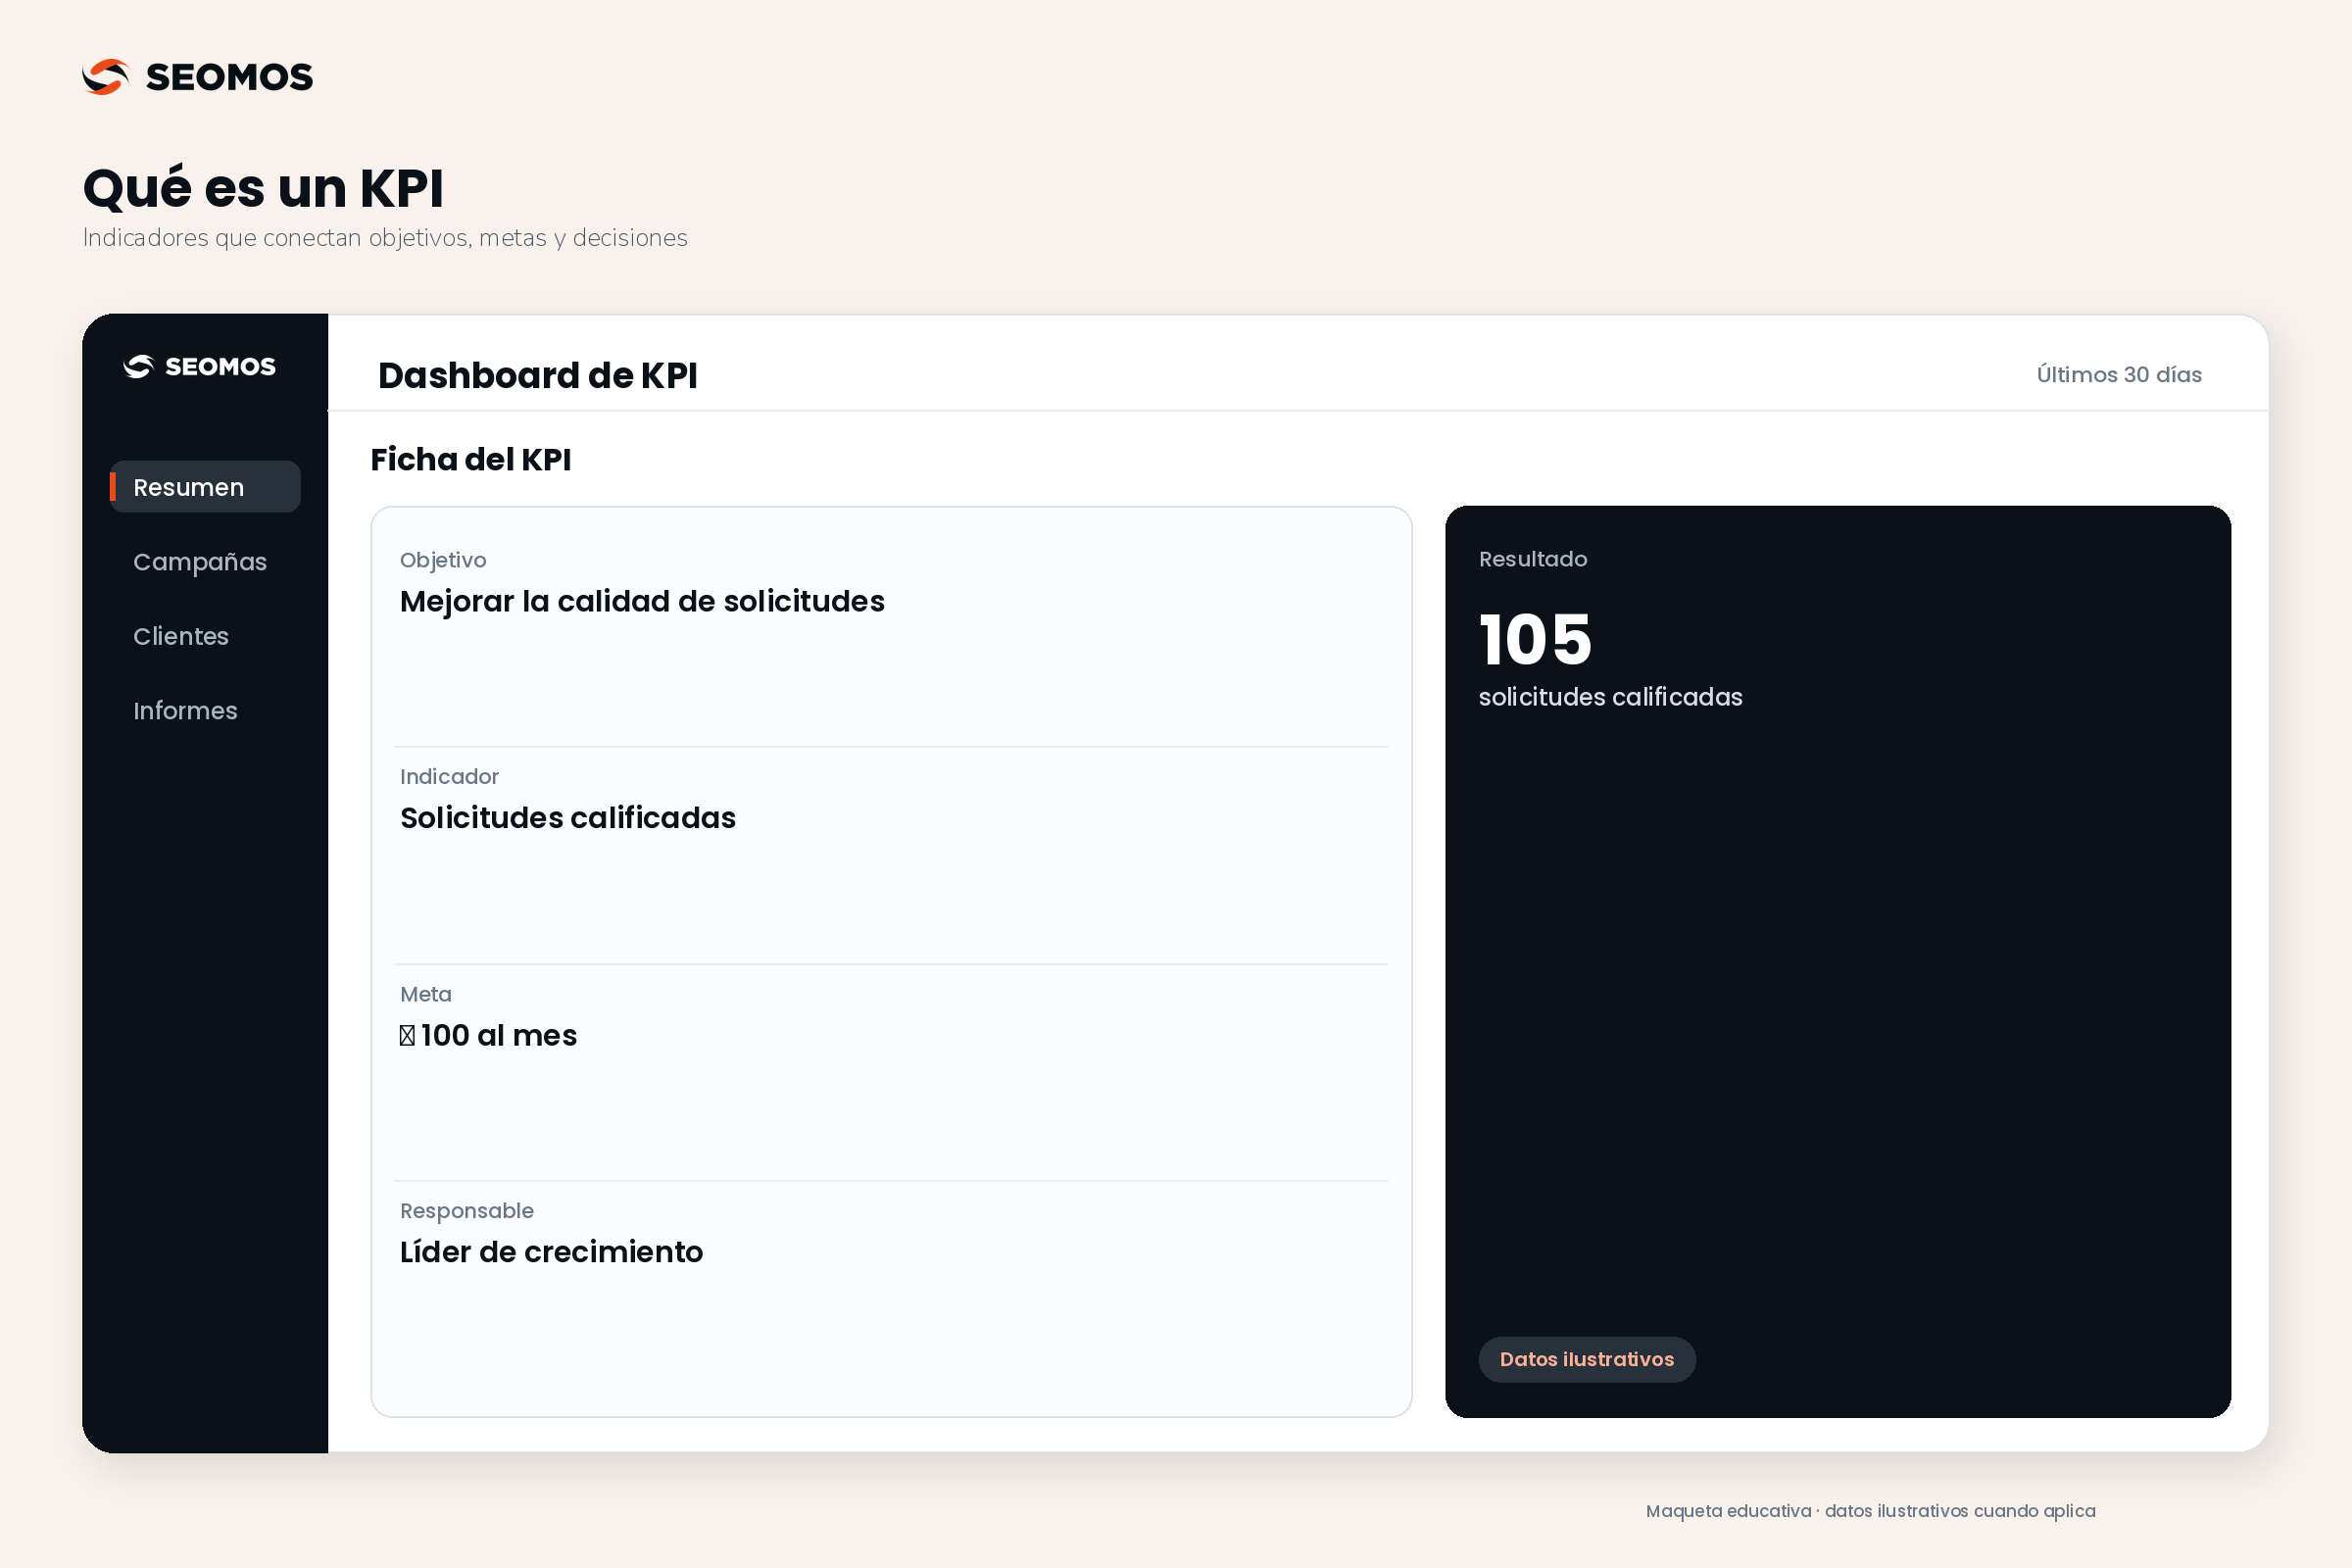
KPI sheet: the fields that should be written down
A brief summary avoids recurring discussions about the meaning of the number. This example is a working proposal that you should adapt to your operation; its goals are not universal references.
| Field | Definition of the exercise |
|---|---|
| Aim | Grow in opportunities suitable for the main service. |
| KPI | Monthly number of qualified and deduplicated applications. |
| Rating criteria | Three criteria are reviewed using the same protocol: compatible need, market served, and valid commercial request. |
| Baseline and goal | 80 per month; reach 100 by the end of the quarter. |
| Main source | Commercial record reconciled with forms and conversations. |
| Responsible | Marketing Manager, with review of the sales team. |
| Frequency | Weekly diagnosis and monthly closing with complete data. |
| Controls | Maximum cost per qualified request of 150,000 COP and agreed response capacity. |
| Exclusions | Spam, internal tests and duplicates, while maintaining traceability. |
Add the cut-off date, definition version, and change history. If you modify the rating criteria, mark a comparability break. The same label may hide a different series after a form or business procedure is changed.
Example of a marketing KPI: more forms is not always better
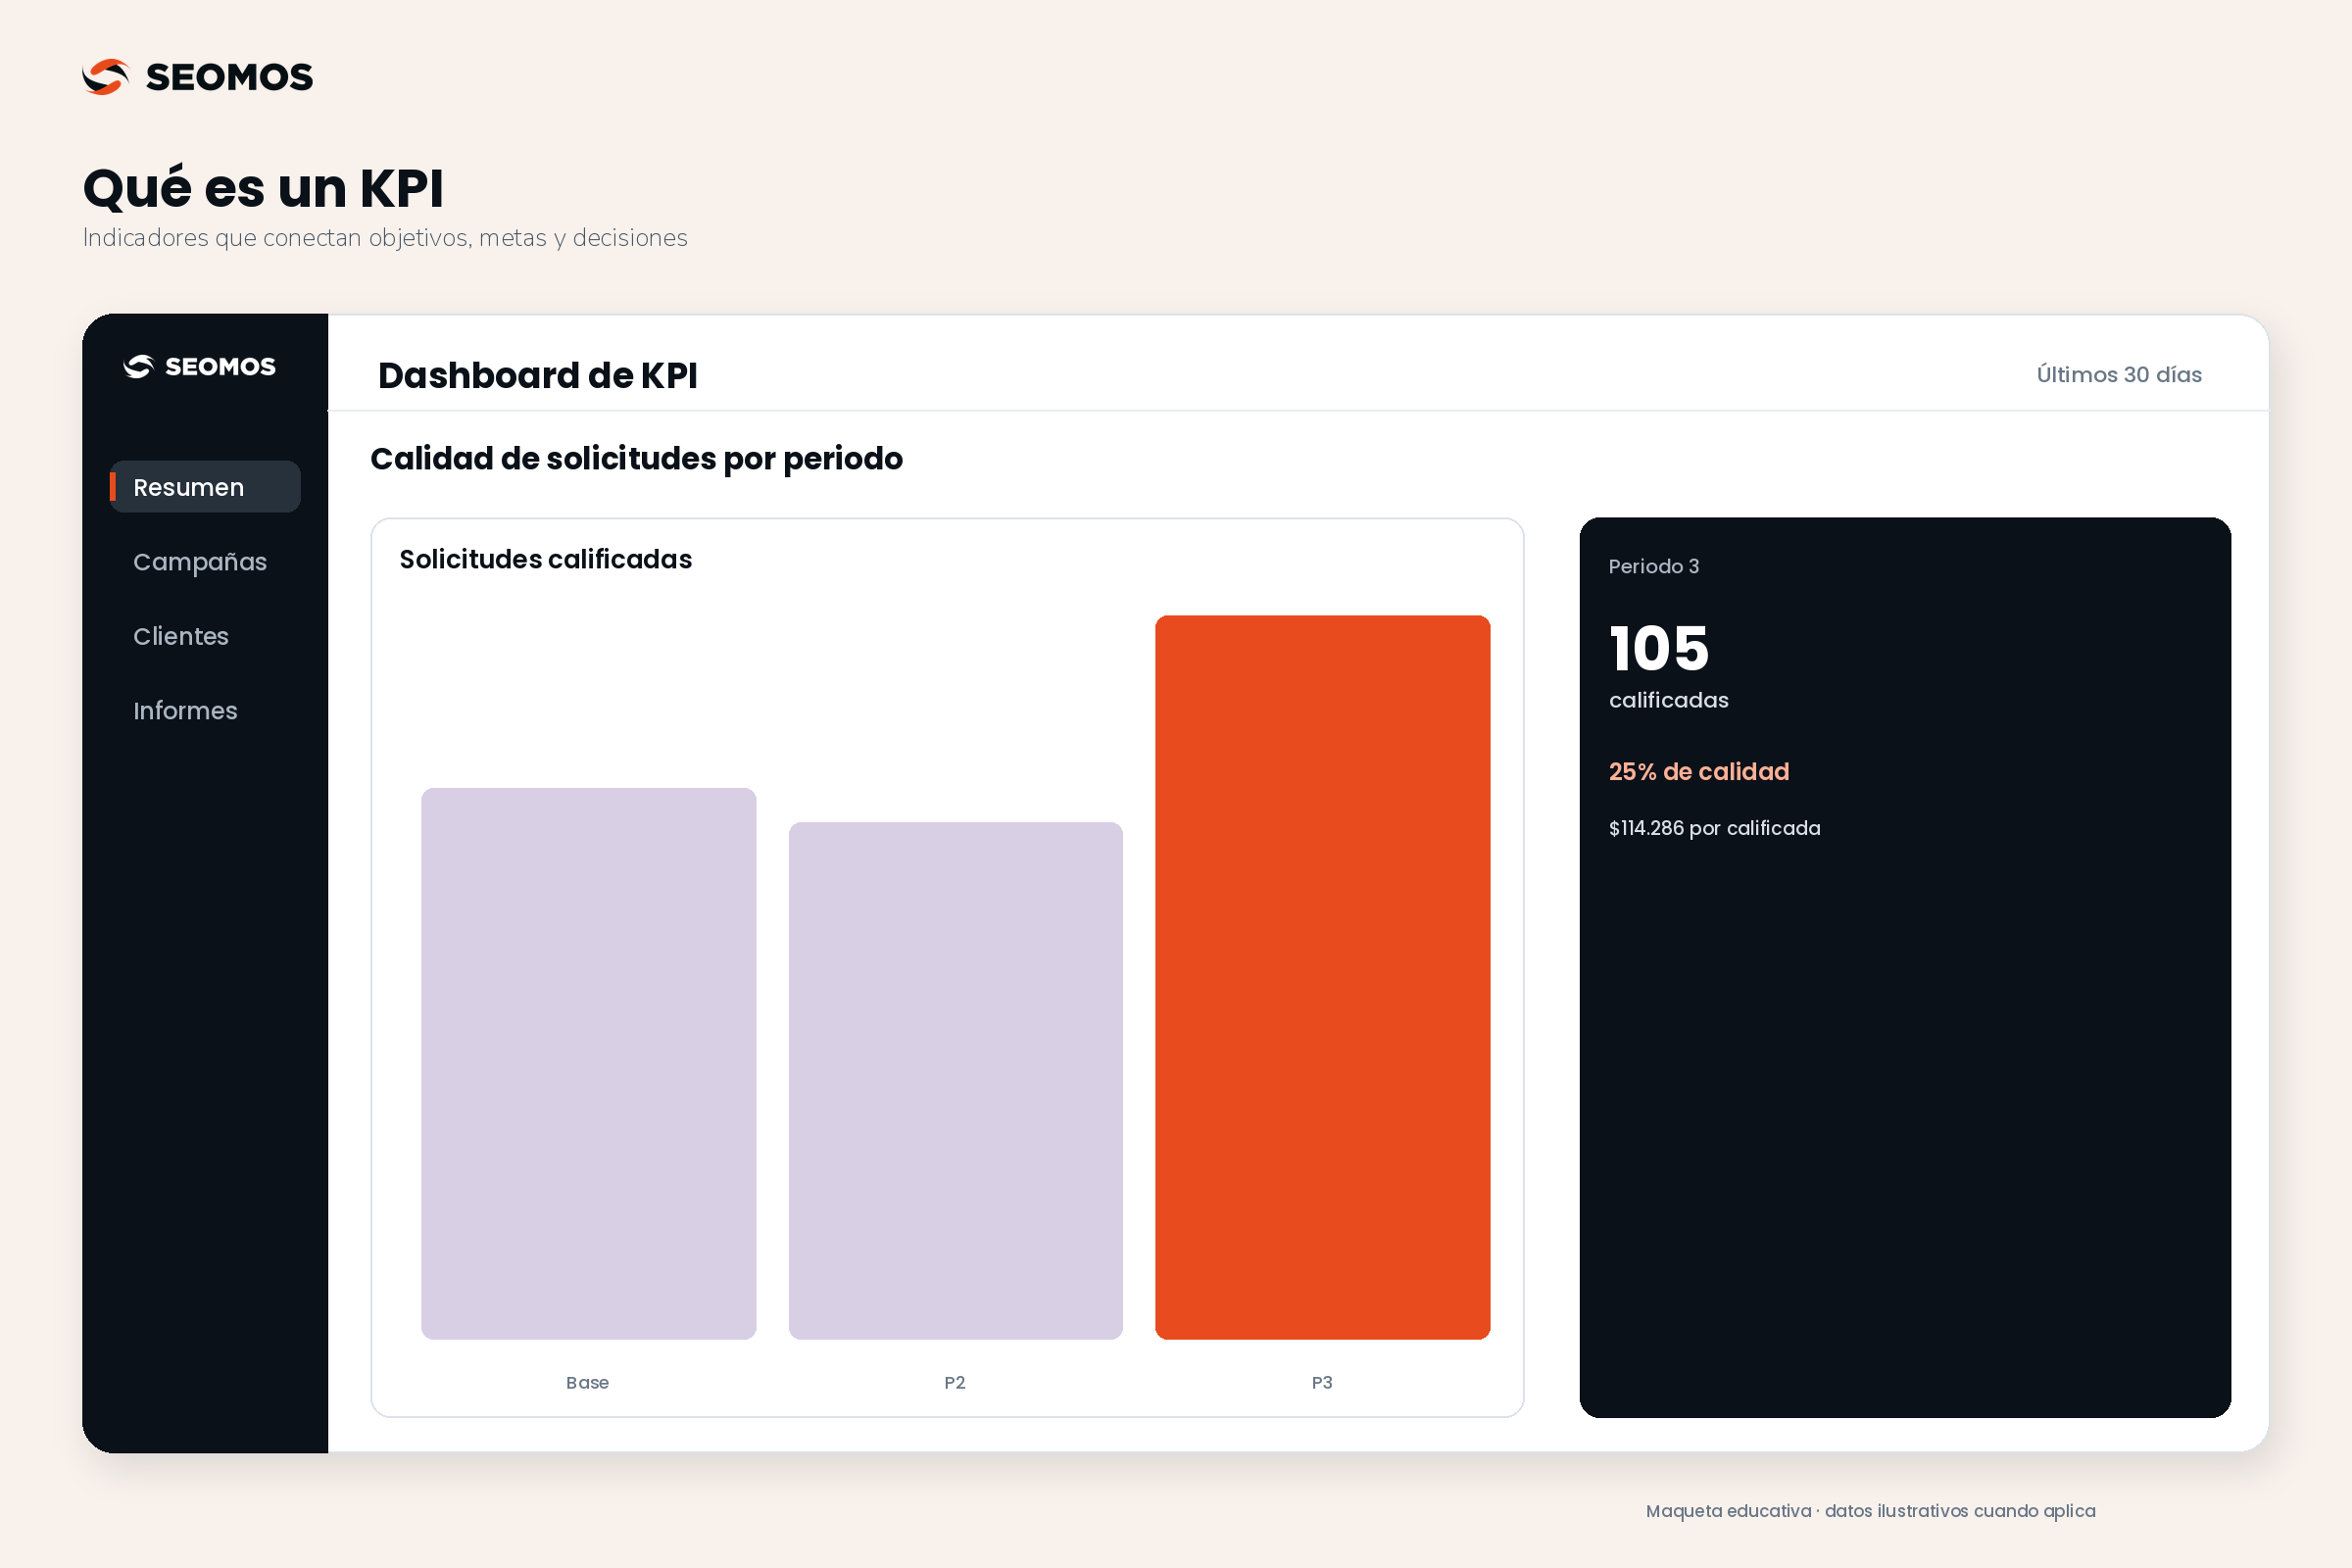
Hypothetical exercise, unrelated to SEOMOS results. A company allocates COP 12,000,000 monthly to the acquisition under analysis. It decides to measure qualified applications, with a target of 100 per month and a limit of COP 150,000 per qualified application. We are not calculating Customer Acquisition Cost (CAC): not all of these applications have yet resulted in customers.
| Indicator | Base period | Period 2 | Period 3 |
|---|---|---|---|
| Total applications | 400 | 500 | 420 |
| Qualified applications | 80 | 75 | 105 |
| Qualified proportion | 20 % | 15 % | 25 % |
| Cost included | 12,000,000 COP | 12,000,000 COP | 12,000,000 COP |
| Cost per qualified application | 150,000 COP | 160,000 COP | 114,286 COP approx. |
In period 2, the number of forms increased by 25, but qualified applications fell from 80 to 75. The qualified proportion dropped from 20 to 15: a reduction of five percentage points, equivalent to 25 % of relative drop. These are two different ways of describing the change.
The team reviews queries, messages, traffic sources, and business criteria. In period 3, 105 qualified requests appear, and the unit cost drops to approximately 114,286 COP. The main KPI exceeds the target, and cost control remains within limits.
This allows us to investigate what changed, but it doesn't prove that a specific modification caused the entire improvement. Channel mix, seasonality, and other interventions could all play a role. Furthermore, we still need to observe how many opportunities are closing and what contribution they make. The input indicator doesn't replace the final result.
Examples of marketing KPIs according to objective
Select indicators based on the decision you need to make. This matrix suggests possible relationships; it does not indicate that all indicators must appear together in every company.
| Aim | Candidate KPI | Complementary diagnosis |
|---|---|---|
| Capture adequate demand | Qualified applications from the target market. | Origin, qualified proportion and reasons for discarding. |
| Acquire sustainable customers | full CAC within a defined scope. | Closures, trading duration and contribution. |
| Improve advertising efficiency | ROAS interpreted together with margin. | Purchase value, returns, and attribution. |
| Facilitate a web action | Completion rate of the chosen process. | Errors, dropouts, and differences by device. |
| Increase the value of the relationship | Contribution per customer over a fixed horizon. | Repurchase, tenure and service cost. |
For formulas and their limits, consult the guides of CAC, ROAS y customer lifetime value. Keeping them separate allows this board to focus on decisions and not on an endless collection of acronyms.
In SEO, Search Console provides clicks, impressions, CTR, and average position based on your performance report documentation. These are search signals, not sales figures. To assess commercial demand, you must relate them to what's happening online and in the sales process, without claiming a level of attribution you don't have.
On social media, the usefulness of reach and engagement depends on the objective. You can track discovery and relevant inquiries within a strategy of SEO for social media, keeping exhibition, conversation and confirmed sale separate.
How to connect KPIs with reliable data
Define a primary source for each fact. The ordering system confirms purchases; the business record defines opportunity statuses; the advertising platform reports investment; web analytics monitors events. No single tool should be considered the sole source of all answers by default.
Google Analytics allows you to mark as key events actions that are especially relevant to the business. Marking an event doesn't automatically make it a complete KPI: you still need to decide what objective it measures, how it's measured, and what action it triggers.
To understand where an action is lost, the GA4 funnel explorations They allow you to observe defined steps. Verify their sequence, entry conditions, and the unit counted. A user funnel should not be compared without adjustments to a count of repeated events.
If the objective depends on a landing page, Test your measurement from the form to the business record. Exclude internal tests from operational reports and ensure that a retry does not generate two attempts. Missing data must be identified as such, not simply rendered as zeros.
How to review a dashboard and turn it into actions
Organize the review around four questions: Did we meet the goal? Is the data comparable? Which segments explain the variation? And what action will we test? Accompany each KPI with current value, target, period, trend, and update date.
Color helps to pinpoint a signal, but it doesn't replace explanation. A value in red could be provisional data, a measurement problem, or a real deviation. Before changing your budget, distinguish between these possibilities. Also, don't average rates from groups of different sizes: consolidate their numerators and denominators.
Record the decision, a responsible person, and a date to evaluate the outcome. In a strategy of SEO positioning, The timeframe should allow for observation of demand and changes in visibility. paid media, Also review conversion delays and operational limits. The frequency of monitoring data doesn't have to be the same as the frequency of intervention.
Mistakes to avoid before presenting results
- Measure by availability. Choosing the data that appears first on a platform even if it does not correspond to the objective.
- Change the goal later. Adjust it to declare success instead of explaining the deviation.
- Optimize a single figure. Increasing contacts at the expense of quality, margin, or attention capacity.
- Compare incomplete periods. Interpreting provisional data as a definitive conclusion.
- Hide definitions. Presenting "conversions" without stating what action or population is being counted.
- Forget the decision. Produce a report that nobody uses to prioritize work.
Before finalizing, ensure each KPI has a purpose, formula, source, target population, responsible party, and frequency. Add a quality control checklist and a review rule. This framework provides a more solid foundation than simply multiplying the number of charts.
Frequently Asked Questions about KPIs
What is a KPI in simple terms?
It's a metric that helps you know if you're making progress toward an important goal. For it to be useful, you need to know how it's calculated, what the goal is, who reviews it, and what decision will be made based on the result. A number without that context can be just a metric.
How many KPIs should my company have?
Focus on the metrics necessary for priority decisions, without a universal number. Start with active objectives and select a few indicators per person responsible. Keep additional metrics for diagnostic purposes, but avoid letting them compete for attention with the results that truly guide the work.
Can followers and likes be KPIs?
They can be useful if they serve a defined purpose and are interpreted within their limitations. They don't demonstrate sales, profitability, or audience quality on their own. If you're looking for business opportunities, accompany them with relevant inquiries and sales process results.
How often should I review my indicators?
It depends on the speed of the process and when the data is complete. You can review measurement errors frequently and evaluate business results over longer periods. Define both timeframes to avoid hasty decisions based on minor variations or pending conversions.
What is the difference between percentage and percentage points?
If a rate drops from 20 % to 15 %, it falls by five percentage points. The relative drop is 25 %, because the difference of five is divided by the initial value of twenty. Specify which one you use to avoid exaggerating or minimizing the change.
Do I need a paid tool to measure KPIs?
Not necessarily. A well-defined spreadsheet can be a good starting point. The essential thing is to have reliable, accountable data and a review process. A more advanced tool makes sense when it reduces errors or workload and addresses the team's specific needs.
Sources consulted
Consultation and editorial review: . The goals, results tables, and fact sheets in this guide are my own hypothetical examples.